
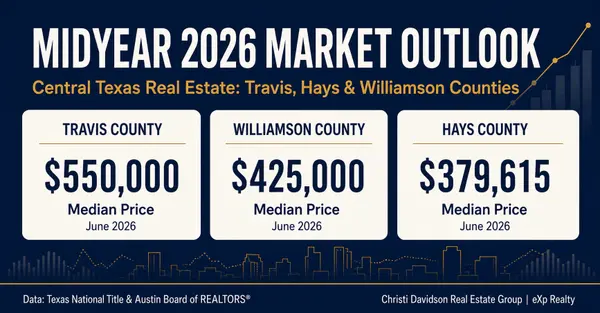
Austin Is NOT Declining — It's Dividing
What the May 2026 Median Sales Price Heat Map Reveals About Your Zip Code
By Christi Davidson | Christi Davidson Real Estate Group | eXp Realty
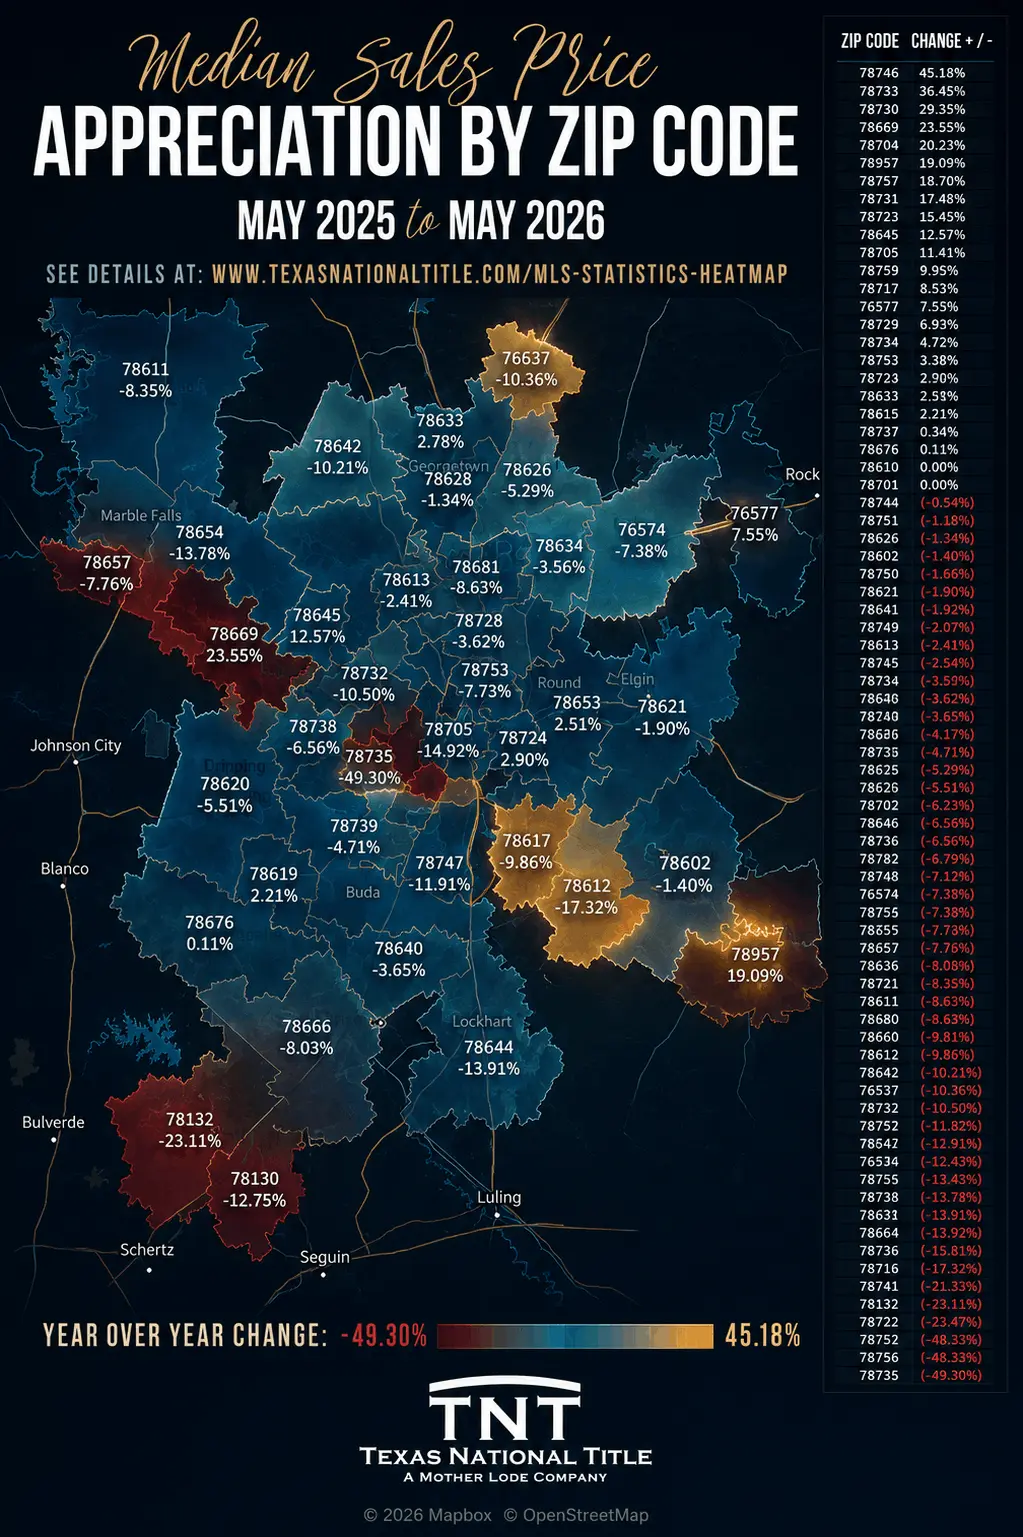
If you've been watching the Austin real estate market and wondering whether to feel worried or encouraged — the answer is: it depends entirely on where you are. The May 2026 Median Sales Price Appreciation Heat Map, compiled by Texas National Title, reveals something far more nuanced than a single market trend. What we're really seeing is two Austins emerging — and which one you're in makes all the difference.
The spread across zip codes is remarkable: from +45.18% appreciation in 78746 to -49.30% in 78735. That's a nearly 95-point gap in median price performance across the same metro area, measured over the same 12-month window. That is not a market in retreat — that is a market in transformation.
🏆 The Winners: Where Values Are Climbing
Let's start with the good news. Several Austin-area zip codes are experiencing strong, meaningful appreciation — and they share some important characteristics.
|
Zip Code |
YOY Change |
Area / Notes |
|
78746 |
+45.18% |
Westlake / Rollingwood — prestige corridor |
|
78733 |
+36.45% |
Westlake Hills — high-demand, low-inventory |
|
78730 |
+29.35% |
River Place / Northwest Hills corridor |
|
78669 |
+23.55% |
Lago Vista / Lake Travis area |
|
78704 |
+20.23% |
South Congress / Bouldin Creek |
|
78957 |
+19.09% |
Smithville area — emerging value corridor |
|
78757 |
+18.70% |
Crestview / Allandale — inner north |
What do these winning zip codes have in common? Lifestyle desirability, supply constraints, strong school systems, and proximity to top employment corridors. Westlake (78746, 78733) continues to be one of the most resilient luxury markets in the country. Crestview and South Congress are holding strong as walkable, character-rich urban neighborhoods. And Lake Travis-area zip codes are benefiting from ongoing lifestyle migration from higher-cost metros.
⚠️ The Story in the Middle: Modest Declines
A significant cluster of Austin zip codes — including many of the high-growth suburban rings that saw explosive pandemic-era appreciation — are now experiencing moderate corrections in the -2% to -10% range. These aren't alarming numbers, but they are a signal.
Zip codes like 78628 (Georgetown), 78681 (Round Rock), 78613 (Cedar Park), 78634 (Hutto), and 78753 (North Austin) are each down modestly — reflecting inventory normalization and buyer selectivity in areas that ran very hot between 2020 and 2023. The market is repricing from peak. This is healthy, if uncomfortable for sellers who bought or refinanced at the top.
The message for sellers in these areas: pricing discipline and presentation quality are non-negotiable. Buyers have options now. Your home needs to earn its price.
🔴 The Deep Correction Zones: What's Really Happening
Then there are the zip codes showing the most significant declines, and understanding WHY they're correcting is critical to not misreading the broader market.
|
Zip Code |
YOY Change |
Area / Likely Driver |
|
78735 |
-49.30% |
Barton Creek / Southwest — outlier correction |
|
78756 |
-48.33% |
Rosedale / Hyde Park area |
|
78722 |
-23.47% |
East Austin — investor/condo correction |
|
78741 |
-21.33% |
Southeast Austin — affordability pressure |
|
78132 |
-23.11% |
New Braunfels corridor — overbuilt |
|
78612 |
-17.32% |
Cedar Creek — rural/exurb correction |
|
78744 |
-13.91% |
SE Austin / McKinney Falls area |
The 78735 number (-49.30%) deserves special attention. This is likely driven by a small number of luxury transactions with highly variable price points — a single large sale year-over-year can swing a zip code dramatically when transaction volume is low. It is not an indicator that Barton Creek is collapsing; it's a statistical artifact of thin high-end inventory. Always interpret percentage swings in low-volume zip codes with context.
78756 (Rosedale/Hyde Park) at -48.33% similarly warrants a closer look — this historic inner-city neighborhood is one of Austin's most sought-after. Mid-point pricing adjustments and a shift in the types of properties transacting are more likely explanations than neighborhood decline.
The Southeast Austin and exurban corridors (78741, 78612, 78132) reflect real affordability pressure and, in some cases, overbuilding during the pandemic rush. These areas require patient, strategically priced selling and honest buyer counseling on long-term value trajectory.
📍 The Bifurcated Market: What It Means for You
Here's the framework I use with every client right now: Austin is not one market. It is a collection of neighborhood-level markets, each with its own supply-demand dynamic, buyer profile, and pricing trajectory. The biggest mistake a buyer or seller can make in 2026 is assuming their zip code follows the metro average.
If you are a SELLER: Your home's value is determined by what is happening in your specific neighborhood, not by the headline number. In the appreciation corridors, well-prepared and correctly priced homes are moving quickly. In the correction zones, preparation and pricing discipline aren't optional — they are the difference between a sold sign and a price reduction.
If you are a BUYER: This map is a strategic tool. Some of Austin's most desirable long-term neighborhoods — Westlake, Crestview, South Congress — are appreciating. If you're considering a purchase in a correction zone, understand whether you're catching a dip or stepping into a structural trend. Your agent's market knowledge matters more than it has in years.
✅ The Bottom Line from Christi
I've been working in Austin real estate for over 30 years. What I see in this heat map is not a market in crisis — it's a market that has finished sorting itself out after one of the most unusual run-ups in housing history. The fundamentals that make Austin special — job growth, lifestyle, education, innovation — haven't changed. What has changed is the level of precision required to navigate it.
Whether you're thinking of selling this summer, buying your first home, or repositioning your real estate portfolio, I'd love to sit down with you and walk through what this data means for your specific situation. A heat map tells you the story at 30,000 feet. I can walk you through your block.
📞 Call or text: (512) 426-7399 | 🌐 www.callchristi.com
Christi Davidson Real Estate Group | eXp Realty | Your Trusted Real Estate Advisor for Life
Data source: Texas National Title (TNT) — MLS Statistics Heat Map | May 2025 to May 2026
Categories
Recent Posts


GET MORE INFORMATION