
Central Texas Real Estate: Where We Stand at Midyear 2026 — and Where We're Headed Next
We're officially at the halfway point of 2026, and if you've been watching the Central Texas market as closely as we have, you've probably noticed something: this isn't the market of 2022, and it isn't quite the market of 2023 or 2024 either. It's its own animal — and understanding it is the key to making smart decisions in the second half of the year, whether you're buying, selling, or just watching from the sidelines.
Here's what the data is telling us.
Sales Activity Is Building Momentum
Home sales across the Austin-Round Rock-San Marcos MSA hit 3,210 in June 2026 — up from 2,971 in June 2025 and well ahead of June 2024's 2,797. Every month so far this year has out-produced the same month in 2025, and the trend has been consistently upward since January.
That strength is broad-based:
- Travis County logged 1,464 closed sales in June, its strongest June since 2023 and comfortably ahead of both 2024 (1,244) and 2025 (1,296).
- Williamson County closed 1,080 homes in June, up from 954 a year ago.
- Hays County was the outlier, with June sales of 465 running slightly behind June 2025's 531 — worth watching, but not alarming in the context of a county that's seen dramatic growth over the past three years.
Prices Are Firming Up, Not Falling
After a soft start to the year, median prices across the region climbed steadily through the first half. The MSA median sat at $400,000 in January and closed June at $450,000 — a pattern repeated at the county level:
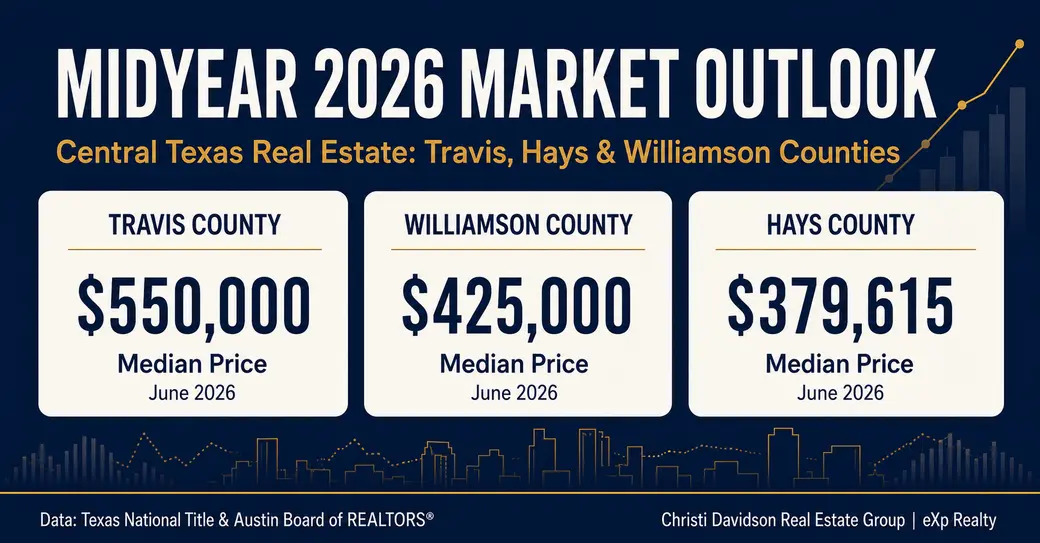
- Travis County median price rose from $450,000 in January to $550,000 in June, essentially matching last June's pace and pushing the average sales price to $769,077, the strongest June average since 2022's peak.
- Williamson County median climbed from $400,000 in January to $425,000 in June.
- Hays County median moved from $336,450 to $379,615 over the same stretch.
None of this points to runaway appreciation, and it doesn't need to. It points to a market that found its footing early in the year and has been building steadily since — a far healthier signal than the sharp spikes we saw in 2022.
Inventory Is Still Elevated, But the Growth Is Slowing
Buyers still have meaningfully more choice than they did two or three years ago. MSA-wide monthly inventory sits at 5.59 months as of June 2026, compared to just 2.10 months at this point in 2022. But compared to a year ago (5.88 months in June 2025), inventory growth has actually leveled off — total listings across the MSA are essentially flat year-over-year at 14,647.
Travis County inventory (5.86 months) and Williamson County (4.95 months) are both tracking close to last year's levels. Hays County is the exception, with inventory still climbing to 5.55 months, giving buyers there the most negotiating room of the three counties.
A Tale of Two Markets at the ZIP Code Level
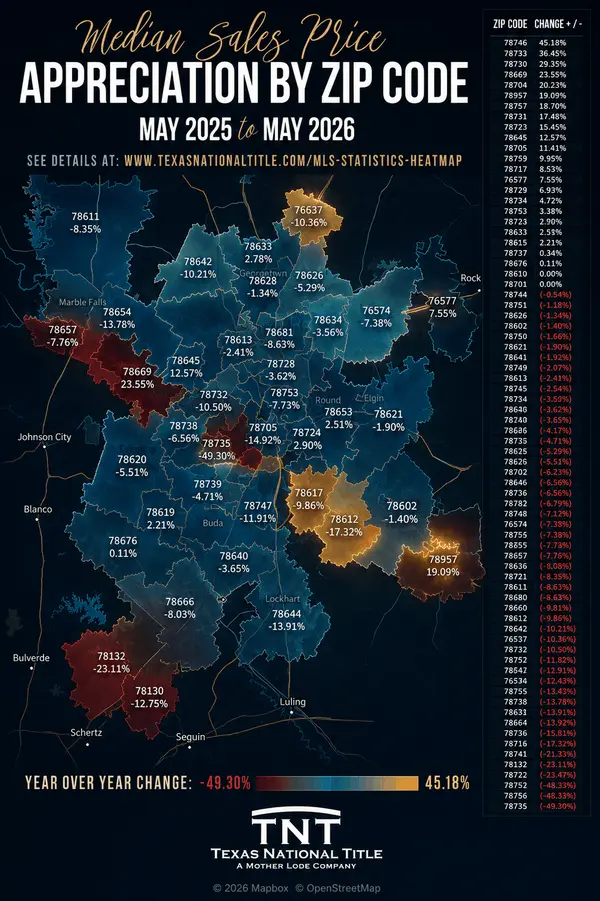
The countywide numbers only tell part of the story. TNT's latest heat map of year-over-year median price appreciation by ZIP code shows just how uneven this recovery has been:
Strongest growth corridors: 76577 (Taylor area) leads the region at +70.18% appreciation, followed by 78657 (Marble Falls, +48.40%), 78733 (Southwest Austin/Lake Austin, +39.53%), 78676 (Wimberley, +33.26%), and 78732 (Lake Travis, +32.78%). These numbers reinforce what we've been telling clients all year: the growth story in Central Texas has shifted outward, toward the Taylor–Georgetown–Lake Travis corridors, even as the urban core cools.
Softer pockets: A handful of ZIPs, including 78957 (-37.56%) and 78736 (-36.82%), saw significant year-over-year declines, and one downtown ZIP (78701) showed a -100% swing that almost certainly reflects an extremely small number of closed sales rather than an actual market collapse — a good reminder that ZIP-level percentages can be noisy in low-volume areas and are best read alongside sales counts, not in isolation.
What This Week's Numbers Add
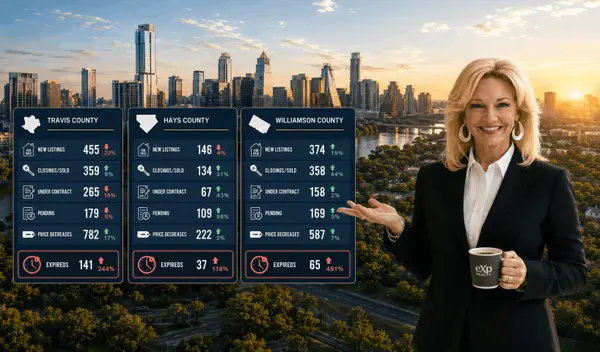
The most recent TNT Market Watch (week of July 20–27) shows Travis County new listings up 8% and pending sales up 6% over the prior three-week trend, even as closings dipped 23% and price reductions rose 23% — a sign that some sellers are recalibrating expectations in real time. Hays County saw new listings pull back 25% and closings down 44% for the week, while Williamson County continued to add both new listings (309) and pending contracts (143) at a healthy clip.
Our Outlook for the Second Half of 2026
Based on where the data stands at midyear, here's what we're watching heading into H2:
- Price growth should continue, but gradually. The steady, month-over-month climb in median prices — rather than a single sharp jump — suggests a market correcting toward sustainable appreciation, not another spike.
- Inventory has likely found its ceiling for now. With total listings roughly flat year-over-year, buyers shouldn't expect dramatically more selection in the fall, but they also aren't likely to see the shrinking inventory that would trigger renewed bidding-war conditions.
- The growth corridors will keep outperforming. Taylor, the Lake Travis area, and Wimberley have shown the strongest and most consistent appreciation all year. We expect that pattern to hold through the second half, particularly as infrastructure and employment growth continue to favor those areas.
- Sellers should price with the data, not the headlines. The rise in price reductions in Travis County this week is a real signal — homes priced ambitively are sitting, while well-priced listings are still moving. Expect this dynamic to sharpen as we move into the traditionally slower fall and winter months.
- Hays County bears watching. It's the one submarket showing softer sales and rising inventory relative to a year ago. That could mean opportunity for buyers there in H2, and it's a conversation worth having if you're considering that area.
The bottom line: Central Texas isn't booming the way it was in 2022, and it isn't correcting the way some headlines suggest either. It's a market finding its balance — and that balance looks different depending on which ZIP code you're standing in. If you're weighing a move in the second half of 2026, now is the time to get specific, local guidance rather than relying on regional averages alone.
Have questions about what this means for your specific neighborhood or property? Reach out to Christi Davidson at (512) 426-7399 or visit www.callchristi.com — we're happy to walk through the numbers for your area.
Data provided by Texas National Title (TNT) and the Austin Board of REALTORS® (ABOR), sourced through the Texas REALTOR® Data Relevance Project and the Real Estate Center at Texas A&M University. Market data is subject to change.
Categories
Recent Posts







GET MORE INFORMATION