
Austin-Area Real Estate Market Update: May 4–11, 2026 — A Market in Transition
The numbers are in for the week of May 4–11, 2026, and the Central Texas real estate market is sending a clear message: supply is tightening, closings are holding, and the gap between buyer and seller expectations is widening. Here's what you need to know.
The Big Picture
Across all three major Austin-area counties — Travis, Hays, and Williamson — new listings declined this week. That's not a one-county anomaly. That's a regional trend. When inventory pulls back across the board, it typically sets the stage for price stability or appreciation — but only if buyers stay engaged. This week's pending and under-contract numbers suggest some hesitation on the buyer side. The two forces are worth watching closely.
Travis County: Closings Strong, Buyers Cooling
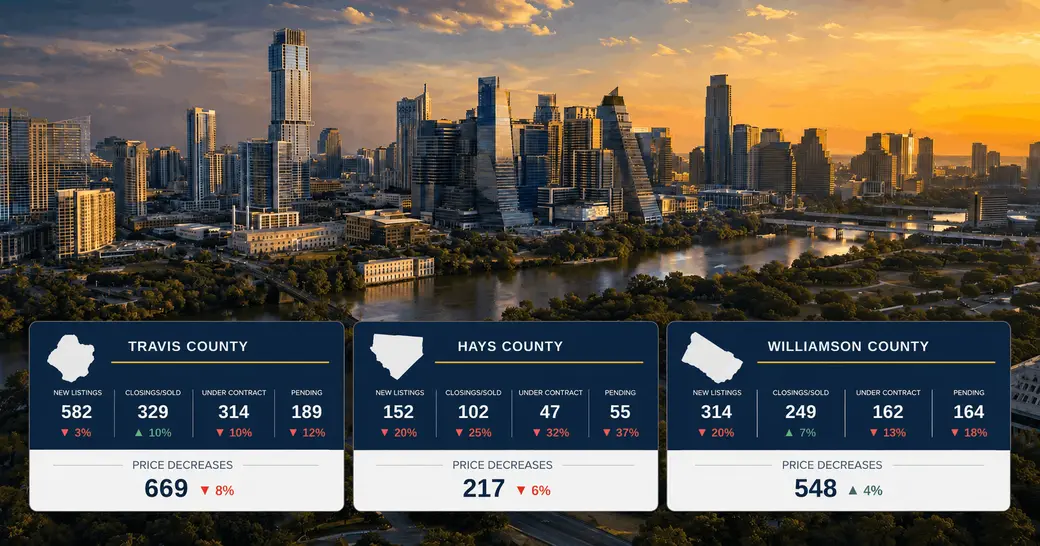
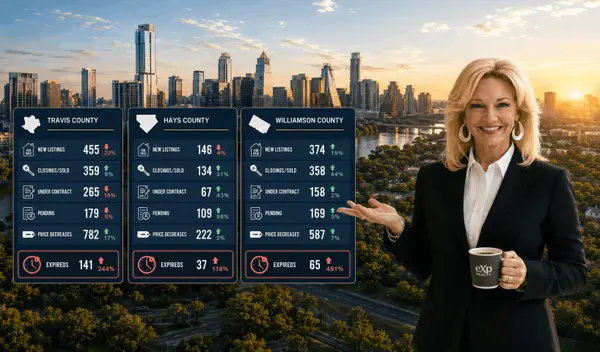
Travis County logged 582 new listings, down 3% from three weeks prior — a modest but meaningful pullback. The headline here is closings: 329 homes sold, up 10%. That's a strong close rate and a signal that committed, well-priced properties are still moving. However, under contract dropped 10% to 314, and pending fell 12% to 189 — meaning the pipeline behind today's closings is thinner than it was. Price reductions declined 8% to 669, suggesting sellers aren't panicking. Expireds ticked up 17% to 41, and withdrawn listings jumped 26% to 98 — a sign that some sellers are pulling back rather than adjusting price.
What it means for Travis County sellers: Your window is real, but pricing precision matters more than ever. Overpriced listings are expiring. Right-priced listings are closing.
What it means for Travis County buyers: Less competition than a year ago, but inventory is tightening. If you've been on the fence, this is the moment to get serious.
Hays County: A Market Recalibrating
Hays County is showing the most dramatic shifts this week. New listings dropped 20% to 152 — a significant supply contraction. Closings came in at 102, down 25%, which sounds alarming until you consider that Hays had an unusually strong close week three weeks prior. Under contract fell 32% to just 47, and pending dropped 37% to 55. Those are numbers to watch. Price reductions declined 6% to 217, and expireds exploded — up 143% to 17. Withdrawn listings were relatively steady at 22, down 4%.
What it means for Hays County: This market is recalibrating. Sellers who chased the Spring optimism with aggressive pricing are now facing expirations. Buyers who waited are finding a market that's more negotiable than six weeks ago — but with less inventory to choose from. Move with intention.
Williamson County: The Steady Performer
Williamson County continues to be the most balanced story in the Austin metro. 314 new listings, down 20%. 249 closings, up 7% — the second-strongest close rate of the three counties. Under contract dropped 13% to 162, and pending fell 18% to 164. Price reductions rose a modest 4% to 548. Expireds fell 31% to just 11 — the lowest expiration rate in the region by far. Withdrawn listings rose 13% to 53.
What it means for Williamson County: Georgetown, Round Rock, Cedar Park, and Leander remain in high demand. Inventory is contracting, closings are healthy, and sellers are holding prices. This is a market where buyers need to move decisively when the right home comes along.
The Bottom Line
The Central Texas market is not crashing. It's not booming. It's transitioning — and transition markets reward preparation, local knowledge, and timing. The buyers and sellers who win in this environment are the ones working with an advisor who understands the nuance behind the numbers, not just the numbers themselves.
That's exactly what we do at Christi Davidson Real Estate Group.
If you're thinking about buying or selling in Travis, Hays, or Williamson County, let's have a real conversation about what this market means for you.
📞 512-426-7399 🌐 www.callchristi.com 📧 Christi@davidsonregroup.com
Data sourced from Texas National Title (TNT) / Austin Board of Realtors (ABOR). The large white numbers represent total new activity during the previous week. Arrows and percentages represent the difference from the Monday three weeks prior.
Categories
Recent Posts


GET MORE INFORMATION