
AUSTIN METRO MARKET UPDATE: The Austin Metro's 2026 Story So Far — And What the Data Says Comes Next

We're seven and a half months into 2026, and the picture that's emerged is worth pausing on. It isn't the frenzy of 2022. It isn't the standoff of 2023. It's a market that spent the first half of the year quietly building momentum — and the newest ZIP-code data shows that momentum isn't landing everywhere the same way. Here's what we're seeing since January, what five years of history tells us about where we go from here, and what it means block by block across Travis, Williamson, and Hays counties.
The View from January to Now: Momentum, Not a Spike
Every month of 2026 has out-produced its 2025 counterpart across the Austin-Round Rock-San Marcos MSA. Home sales climbed from a median-priced $400,000 market in January to $450,000 by June, with closings reaching 3,210 for the month — up from 2,971 in June 2025 and 2,797 in June 2024. That's not a one-month blip; it's the continuation of a steady, monthly build that started at the beginning of the year.
The county-level detail tells a slightly more nuanced story:
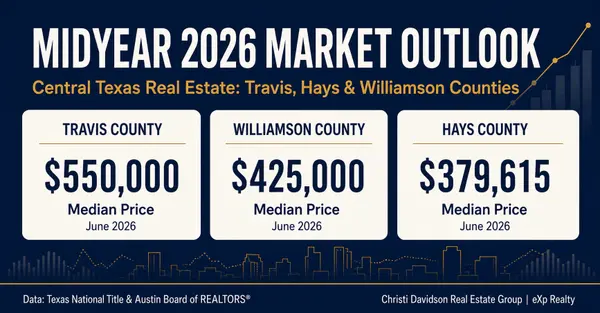
- Travis County posted 1,464 June closings, its strongest June since 2023 and ahead of both 2024 (1,244) and 2025 (1,296). Median price rose from $450,000 in January to $550,000 by June, and the average sales price hit $769,077 — the strongest June average since the 2022 peak.
- Williamson County closed 1,080 homes in June, up from 954 a year earlier, with median price climbing from $400,000 in January to $425,000.
- Hays County was the outlier, with June sales of 465 running behind June 2025's 531 — worth watching, though not alarming given how much growth Hays has absorbed over the past three years. Median price still moved up, from $336,450 to $379,615.
Inventory tells the story of a market that's normalizing rather than tightening or flooding. MSA-wide months of inventory sit at 5.59 as of June, essentially flat against 5.88 a year ago, and total active listings across the metro are holding steady near 14,647 — a very different picture from the razor-thin 2.10 months of inventory buyers were fighting over in 2022.
The Five-Year Lens: Why This Fall Should Feel Different
Zoom out, and Travis County closings show the same seasonal pattern every year: a meaningful pullback between June and September as the summer buyer pool contracts. But the size of that pullback has been shrinking:
- 2022: down 22% (1,588 → 1,243)
- 2023: down 27% (1,475 → 1,083)
- 2024: down 23% (1,244 → 962)
- 2025: down 13% (1,296 → 1,129)
Four years running, the fall slowdown has arrived on schedule — but each of the last two years it's arrived softer than the one before. Combined with June 2026 closings that are already running ahead of the last three years, that points toward a fall that's quieter than summer, as always, but less of a cliff than Austin buyers and sellers have gotten used to since the pandemic-era peak.
The Micro View: A Tale of Two Austins at the ZIP Level
The newest TNT ZIP-code heat map, covering median sales price appreciation from July 2025 to July 2026, shows why countywide averages only tell part of the story. Some ZIPs are appreciating at a pace that would have felt at home in 2021. Others — mostly clustered in the higher-end hill country and lake corridors — are working through a real correction.
Where Appreciation Is Strongest
Central and east Austin infill neighborhoods lead the metro, alongside continued strength out toward Lake Travis:
|
ZIP Code |
YoY Change |
Area |
|
78757 |
+29.84% |
Allandale / Crestview (North Central Austin) |
|
78752 |
+22.95% |
Highland / North Austin |
|
78704 |
+20.53% |
South Austin / Bouldin |
|
78724 |
+20.30% |
East Austin / MLK |
|
78738 |
+18.75% |
Lake Travis / Bee Cave |
These are largely ZIPs where demand for centrally located, walkable, or lake-adjacent inventory has stayed strong even as the broader market cooled from its 2022 highs.
Where Prices Have Pulled Back
The steepest declines are concentrated in the western hill country, lake, and select central Austin luxury pockets — areas that ran hottest during the 2021–22 boom and have given back the most since:
|
ZIP Code |
YoY Change |
Area |
|
78756 |
–29.74% |
Rosedale / Central Austin |
|
78611 |
–25.89% |
Burnet |
|
78731 |
–25.57% |
Northwest Hills |
|
78726 |
–17.21% |
River Place / Far Northwest |
|
78730 |
–16.42% |
Lake Austin / River Place |
|
78745 |
–15.93% |
South Austin (Westgate/Cherry Creek) |
Two figures on the map deserve a data-integrity flag rather than a headline. ZIP 76577 (Thrall) shows a –100% change, and 78652 (Manchaca) shows –39.53% — both are lower-volume ZIPs where a handful of transactions can swing the year-over-year percentage dramatically. We'd treat these as sample-size artifacts, not evidence of a collapse in either area, and we'd caution against reading too much into any single low-volume ZIP without pulling the underlying transaction count first.
What the Rest of 2026 Likely Holds
- Macro: Expect the usual fall pullback in closings — it has happened four years running — but the trend line suggests it should be milder than 2022-2024's 22–27% swings, closer to last year's 13% dip. With inventory flat year-over-year rather than climbing, we don't expect the kind of buyer-leverage surge that defined 2023 and 2024.
- Macro: Price growth so far in 2026 has been steady and broad-based rather than sharp, which is a healthier signal than the spikes of 2022. We'd expect that pattern — gradual, not dramatic — to hold into Q4.
- Micro: The ZIP-level split is likely to persist. Central and east Austin infill areas and the Lake Travis corridor have the demand fundamentals to keep outperforming, while higher-end hill country and lake ZIPs still working through 2022-era price corrections will likely need another few quarters before they stabilize.
- Micro: For sellers, this is a market where a countywide or even ZIP-average number can be misleading in either direction — pricing precision at the street and comp level matters more than it has in several years.
|
The bottom line The Austin metro spent the first half of 2026 building real, broad-based momentum — not a spike, a build. The five-year seasonal pattern says fall will bring the usual slowdown, but the last two years suggest that slowdown keeps getting gentler. And underneath the countywide numbers, the ZIP-level data makes clear this recovery is uneven: some neighborhoods are already back to boomtown appreciation, while others are still working through a real correction. Whether you're buying, selling, or just watching, the right read on your specific ZIP — not the metro average — is what should be driving the decision right now. |
Christi Davidson
Broker Associate, eXp Realty | 30+ years, Austin Metro
512-426-7399 | Christi@davidsonregroup.com | www.callchristi.com
Your Trusted Real Estate Advisor for Life
Sources & Attribution
ZIP-code median sales price appreciation data from the Texas National Title (TNT) Heat Map, July 2025–July 2026. Year-to-date sales, pricing, and inventory figures and five-year county trend data courtesy of Texas National Title and the Real Estate Center at Texas A&M University, via the Texas REALTOR® Data Relevance Project. Additional context from the Austin Board of REALTORS® (ABOR).
Categories
Recent Posts








GET MORE INFORMATION